Cash Reinvestment Revenue in Securities Lending

Chris Benedict,
Director,
DataLend
September 19, 2018
IT HAS BEEN 10 YEARS SINCE the financial crisis of 2008 caused some beneficial owners to suspend their securities lending programs and prompted many central banks to radically cut interest rates to record lows to stave off a financial depression.
Much has changed since then. Beneficial owners have largely returned to securities lending, but with a new focus on more robust performance reporting, as well as viewing securities lending as an alpha-generating activity rather than something to help cover costs (as detailed in a survey of beneficial owners conducted in late 2017 by Funds Europe magazine in conjunction with DataLend).
A host of legislation was passed to curb leverage, overly risky trading strategies and to increase market transparency. Non-cash collateral and term trades have increased as a result of new regulatory requirements and the need for balance sheet efficiency.
In the United States, interest rates have finally begun their slow climb from near zero in the form of several rate hikes from the Federal Reserve that commenced in December 2015 and accelerated in 2017. As of this writing, the Overnight Bank Funding Rate (OBFR), which the securities lending industry generally uses as a benchmark for USD cash collateral-based rebate rate trades, stands at 191 bps.
Agent lenders may be able to make a few extra basis points for their beneficial owner clients by reinvesting the cash collateral pledged by brokerdealers borrowing their securities into a wide array of typically short-duration fixed income instruments.
DataLend investigated the impact that rising interest rates had on returns generated by cash collateralized trades. The net reinvestment rate, or “above-the-line” spread, is the difference between the gross yield and the benchmark rate; it essentially shows the additional revenue generated as a result of the assets purchased with the cash collateral.
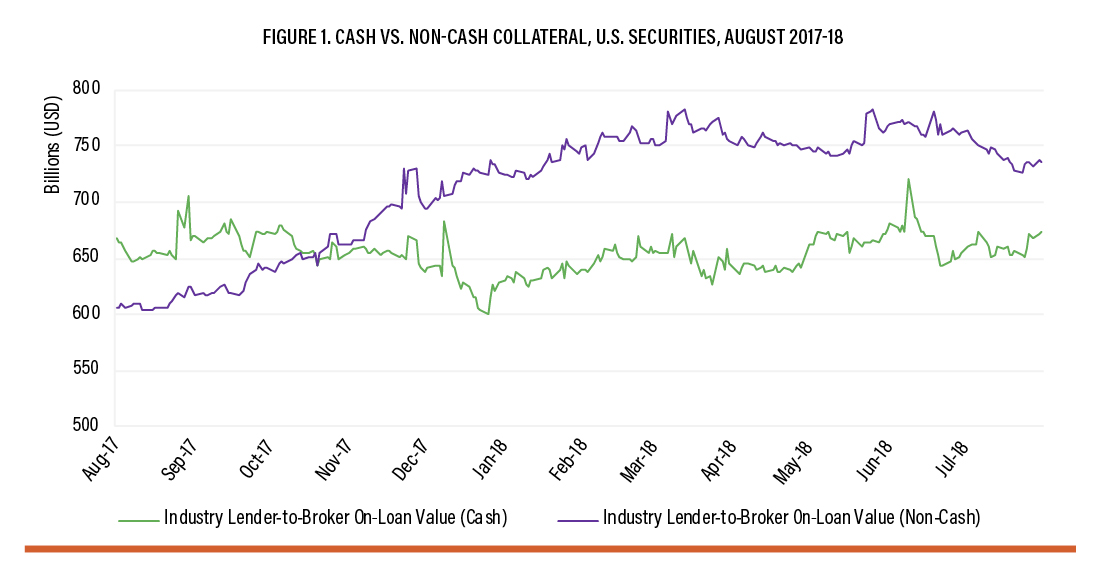
When observing collateral type as a percentage of the global total on loan over time, it is no secret that non-cash collateral has been gaining ground. Thus far, this trend has not changed as a result of the recent interest rate hikes in the U.S.
Figure 1 shows that in late October 2017, the U.S. reached a 50/50 cash versus non-cash collateral split, a big change from how U.S. securities lending long operated as a primarily cash-based market in the past.
The use of non-cash collateral pledged against U.S. assets continued to grow throughout the remainder of 2017 into 2018, where it most recently resided at a 53% non-cash versus 47% cash split. That differs markedly from the rest of the world, which currently shows approximately 85% of all outstanding loans booked versus noncash collateral and only 15% versus cash. Thus far, it seems that the recent interest rate hikes have not caused agent lenders to switch gears and take more cash collateral when lending U.S. securities, most likely due to balance sheet constraints faced by their brokerdealer counterparties.
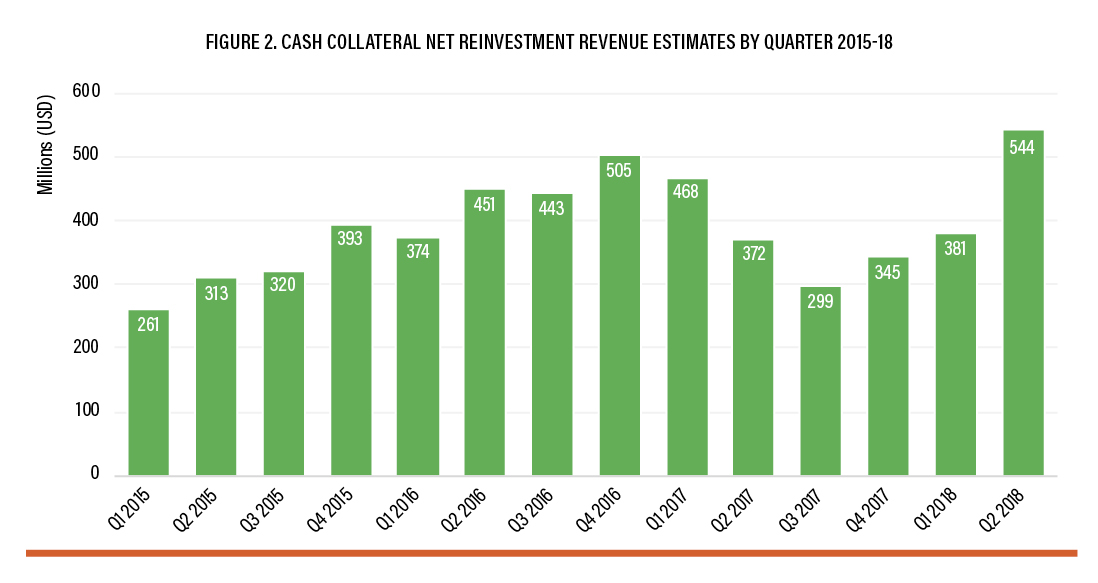
Revenue generation in the cash reinvestment space due to recent rate increases does not seem to be increasing from an absolute standpoint due to the continued decline in cash collateral balances, especially in the U.S. However, when comparing cash reinvestment revenue from the first half of 2018 versus the same timeframe in 2017, we do see a 10% revenue increase of approximately $84.8 million year over year. We also see an encouraging 42% cash reinvestment revenue increase of $163.3 million from Q1 to Q2 2018. Indeed, cash reinvestment revenue reached a threeyear high of almost $543.9 million in Q2 2018. That suggests that cash reinvestment revenue is seeing a bump as a result of rate hikes despite a broader trend away from pledging cash as collateral in securities lending. Cash collateral trades may be becoming more profitable on a per-trade basis due to rising rates.
However, it is important to note that in a rising interest rate environment, rebate rates associated with cash collateral securities lending transactions are immediately updated to reflect interest rate changes; the cash reinvestment side may lag. This is due to reset duration mismatch. Overnight deposits and repurchase agreements will be reset after a day to reflect the interest rate change, but cash reinvestment in longer contractual terms or maturities will not have that option.
To further investigate trends in net reinvestment rates, DataLend researched how the net reinvestment rate looked across the major currencies within the securities finance space. After all, not every market is experiencing rising interest rates. Not surprisingly, for countries that experienced low and negative interest rates, their average net reinvestment rates were also low (or in some cases slightly negative). However, these examples represent an extremely small part of the cash reinvestment market, which is dominated primarily by the USD, and to a lesser extent CAD and AUD. While we see some fluctuations in the average net reinvestment spread for USD, the data shows that agent lenders are reinvesting cash collateral profitably for their beneficial owners, and generally the average net reinvestment spread appears to be on the rise.
Of course, there is more to cash reinvestment revenue than just interest rates. Duration of the reinvestment, as well as the cash reinvestment vehicle itself, will have a significant impact on yield. Given the recent trends, it would seem that cash reinvestment desks in the U.S. may have a more profitable year in 2018 than in years past.