Australia: Down Under in Securities Finance

Robert Antelmann,
Product Specialist,
DataLend
September 19, 2018
THE AUSTRALIAN EQUITIES market was placed third in Asia Pacific by market size behind Japan and Hong Kong, respectively, in 2017.
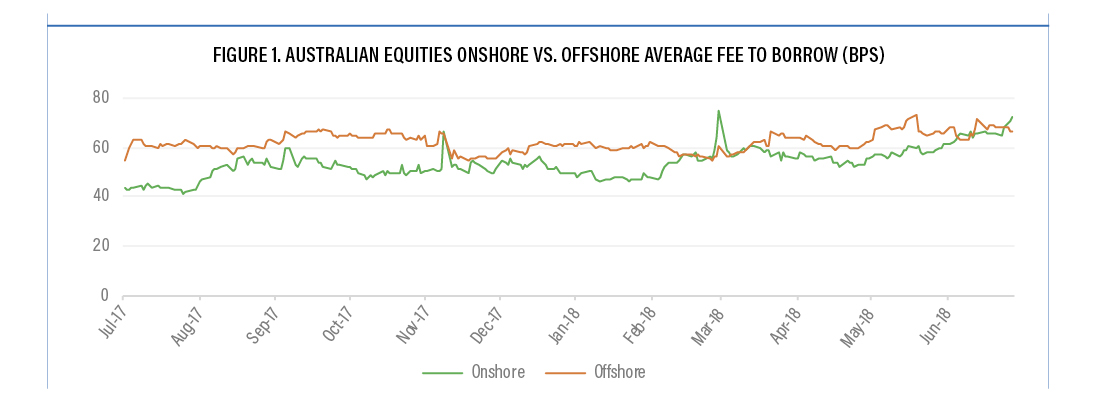
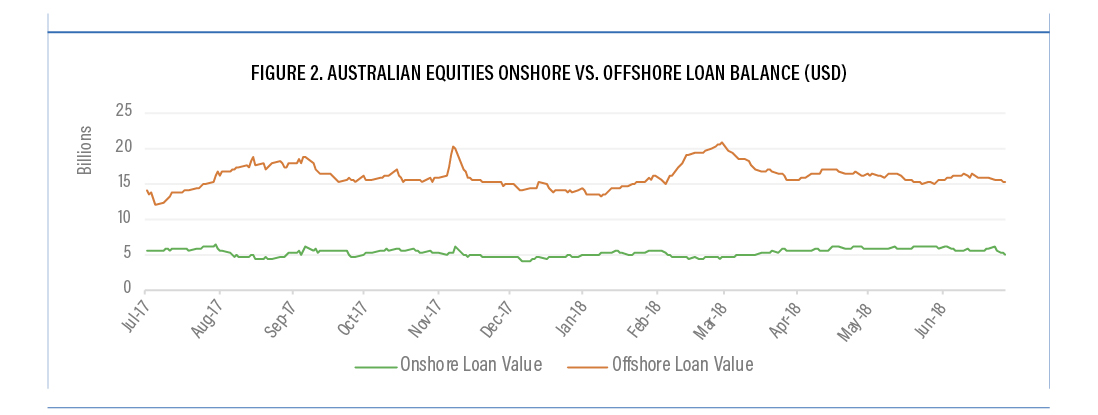
The equities securities lending market in Australia is characterized by a decentralized network of bilateral relationships consisting of both onshore and offshore participants. A cost differential between onshore and offshore beneficial owners creates a premium for offshore supply on GC positions, with offshore rates averaging 68 basis points at the end of May 2018, compared to 56 bps for onshore. Typically, the offshore loan balance for Australian equities is roughly three times that of the onshore positions.
While Australia continues to be a predominantly GC market, the percentage of the market in the super GC range trading at 15 bps or below has almost completely disappeared. The proportion of securities trading up to 25 basis points has dropped from 78% of the market in 2017 to 66% of the market at the end of July 2018.
Meanwhile, super specials, or those securities with fees above 500 bps in the securities lending market, have more than doubled from $271 million (USD) on loan, or 1.47% of the market, to over $700 million on loan, or 3.9% of the market. The largest increase has been in the warm space, from $1.1 billion on loan (6.26% of the market) to $3.4 billion (18.59%).
Rising Balances and Revenue
Australia saw a large withdrawal of participants from the securities finance market following the financial crisis, with the Australian Securities and Investments Commission (ASIC) banning both covered and naked short selling in September 2008. The ban on covered short selling was lifted after amendments to the Corporations Act, which required covered short sales to have a “presently exercisable and unconditional right to vest” the security being sold.
With current securities lending agreements providing lenders the right to cancel a trade at any point up to settlement, regulatory requirements to have unconditional right to vest has challenged the market. Further challenges around proxy voting for annual general meetings (AGM) and extraordinary general meetings (EGM) create a supply squeeze as domestic positions are recalled over AGM period in October and November each year.
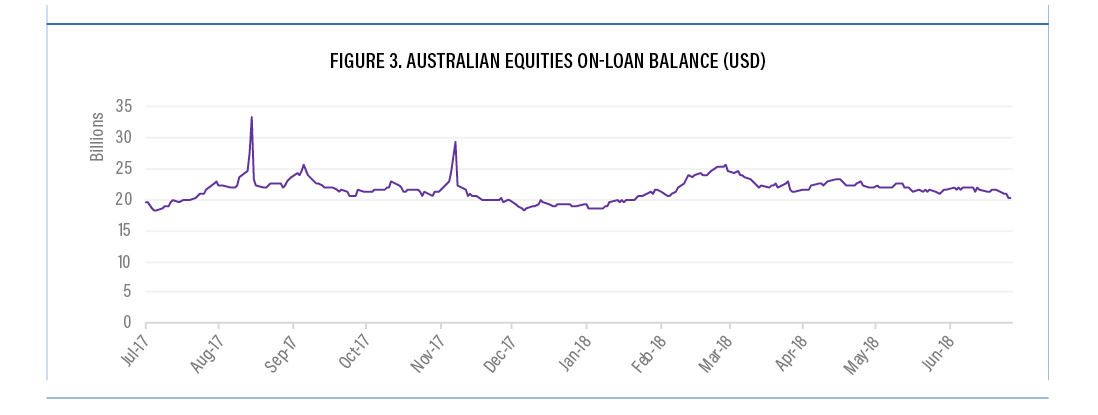
The Australian equity market has seen loan balances steadily increase over the last three years from $13.3 billion at the start of 2015 up 52% to $20.2 billion as of July 31, 2018, on the back of both increased volumes and asset values.
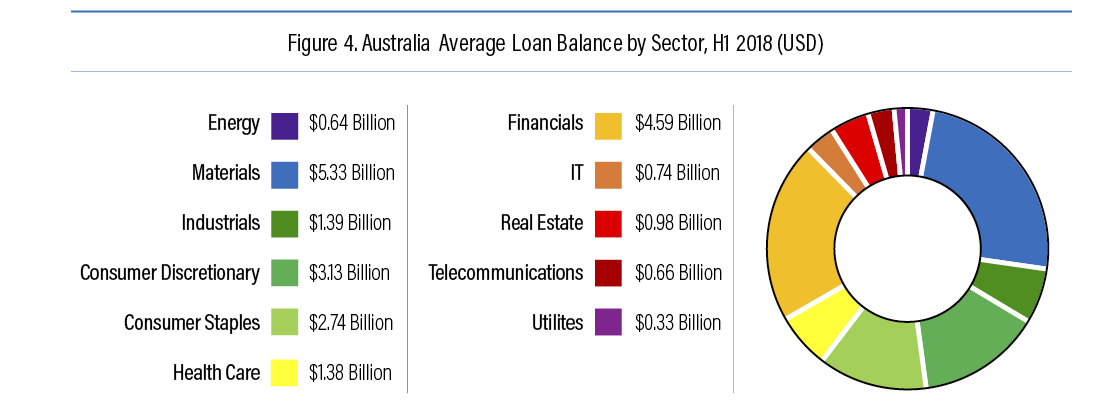
For 2017, revenue across both equities and fixed income stood at $112 million. Rates averaged 45 bps with loan balances of $25.17 billion. The market is heavily dominated by the Consumer Staples, Consumer Discretionary, Financials and Materials sectors, comprising around 75% of loan balances as of July 31.
JB Hi-Fi (JBH AU) and Harvey Norman (HVN AU) have some of the largest balances in the Consumer Discretionary sector as the companies face concerns over consumer demand amidst a cooling housing market and as Amazon enters the local market.
The big four banks in Australia—The Commonwealth Bank (CBA AU), Australia and New Zealand Bank Group (ANZ AU), Westpac (WBC AU) and National Australia Bank (NAB AU)—have all come under pressure on the back of the Royal Commission investigating misconduct in the financial services industry. The Mining sector continues to face adjustment after the mining boom, while concerns over how a trade war between the U.S. and China would impact Australia’s largest trading partner, China, weighs on the likes of BHP Billiton, Rio Tinto and Amcor.
Fixed Income
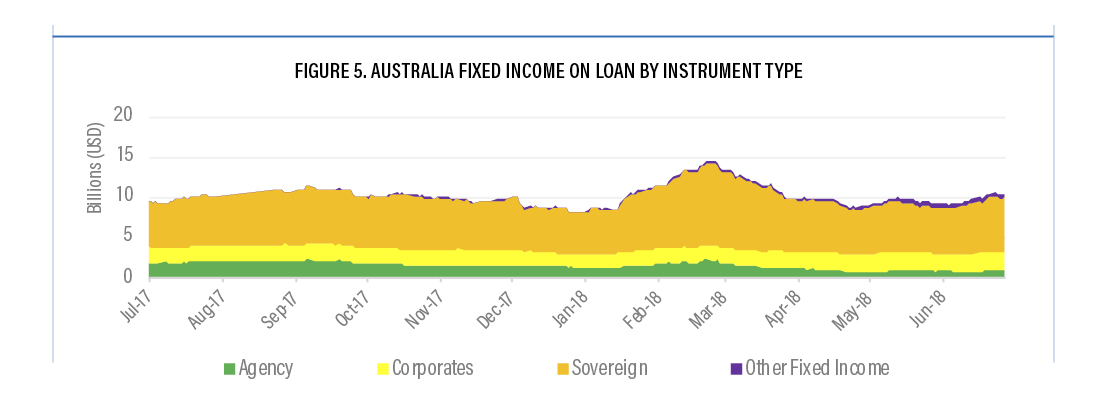
The Australian fixed income market exhibits a concentration around high-grade instruments of sovereign and agency debt, similar to trends observed in the international market. The concentration around this government-issued debt is largely due to regulatory factors, such as Basel III, and the impacts on the balance sheet of holding high-quality liquid assets (HQLAs).
Issuances across Australian government securities have seen a significant increase since 2008; as a result, the federal deficit has ballooned from around $60 billion (AUD) in 2008 to over $500 billion (AUD) in 2017. The increased issuance and corresponding market size have attracted both domestic and offshore institutional participants to the local bond lending market.
Collateral
Regulatory changes globally, including a push to central clearing in the derivatives market, have raised both the demand and cost of collateral. The importance of collateral management has become a key part of any securities lending program.
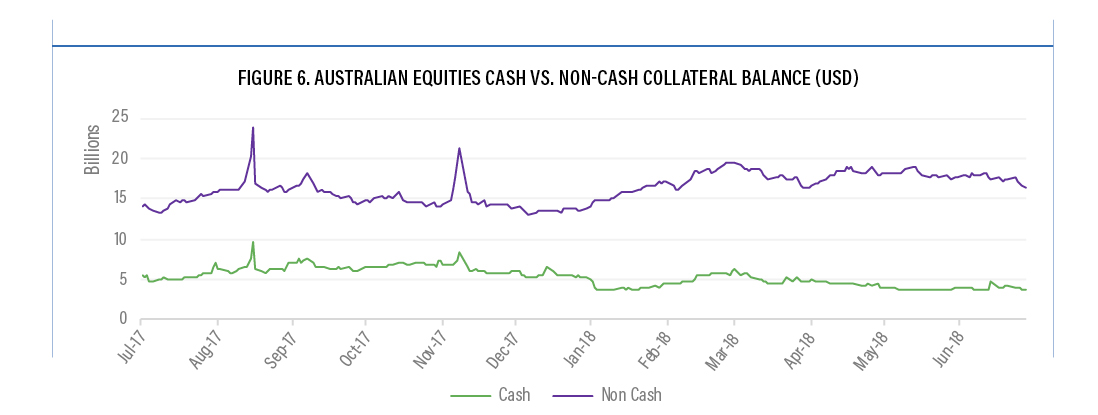
While historically Australian collateral has been transacted on a bilateral basis, the role of tri-party agents in the market has increased in recent years, as has the increased diversity of eligible collateral. Both globally and domestically, the use of non-cash collateral has risen. Cash collateral balances against Australian equities are down 14% since the beginning of 2015, while non-cash balances have increased 84% to $16.4 billion.
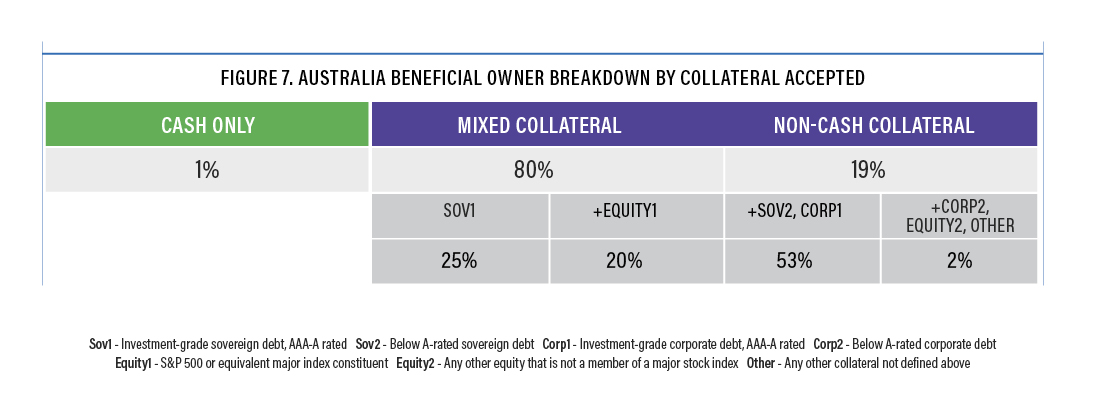
Australia is well placed against its global peers in terms of collateral flexibility, with a more balanced acceptance of both high- and midgrade collateral across sovereigns, corporates and equities. An analysis of Australian-domiciled beneficial owners found that only 1% took cash collateral only. The majority, at around 80%, accepted both cash and noncash, with the remaining 19% taking non-cash only.
Within the non-cash space, high-grade collateral of AAAto A-rated debt was accepted by 25% of participants, while 20% approved primary equity index securities. Fiftythree percent accepted sovereign debt less than A rated, with only 2% accepting A-grade corporates or other equities.
The Australian market continues to be an important part of the Asia-Pacific securities finance market, exhibiting a mix of both onshore and offshore participants across both equities and fixed income. Australia is a relatively developed market when compared to other countries in the Asia region and thus GC in nature; the rate of return does not compare to Korean or Taiwanese securities, but increased participation and market value in Australia have driven up balances and revenue relative to its peers.
