Securities Lending 101: Understanding Market Metrics
October 2019
By Matthew Ross, Nagisha Devala & Chris Benedict, Product Specialists, DataLend
SECURITIES FINANCE market participants sift through a number of lending metrics every day and are quite familiar with demand and volatility indicators such as fees to borrow, utilization, short interest, lendable quantity, days to cover and others. While these are likely amongst the most well-known metrics, there is another figure that can provide insight into a security’s activity and volatility: average duration. Average duration is a measure of how long a trade is open, from the time that the security is borrowed to the time that it is returned back to the lender.
Volume-weighted average duration is calculated for each security via the following formula:

In this formula, the open-loan duration is the number of days between the settlement date of a trade versus the current date.
The average loan duration of a security can change as a result of new loans being booked or loans being returned or recalled. Market demand, fees and supply are critical factors driving these activities and can have a significant impact on the average duration of a security.
In some instances, as demand for a security increases and fees rise, borrowers may return high-fee shares in search of cheaper supply; this scenario may occur as securities previously trading GC begin trading warmer, or as warm securities begin trading hot. In such cases, there is usually still supply available in the market, allowing borrowers to be price conscious. However, this is not the case with hot securities trading hotter. Hot securities typically have very high utilization figures, indicating a dearth of supply. Borrowers with positions in hot securities being re-rated may be unable to source alternate supply and therefore may need to absorb higher costs. As shares are not returned, the average duration figure remains high.
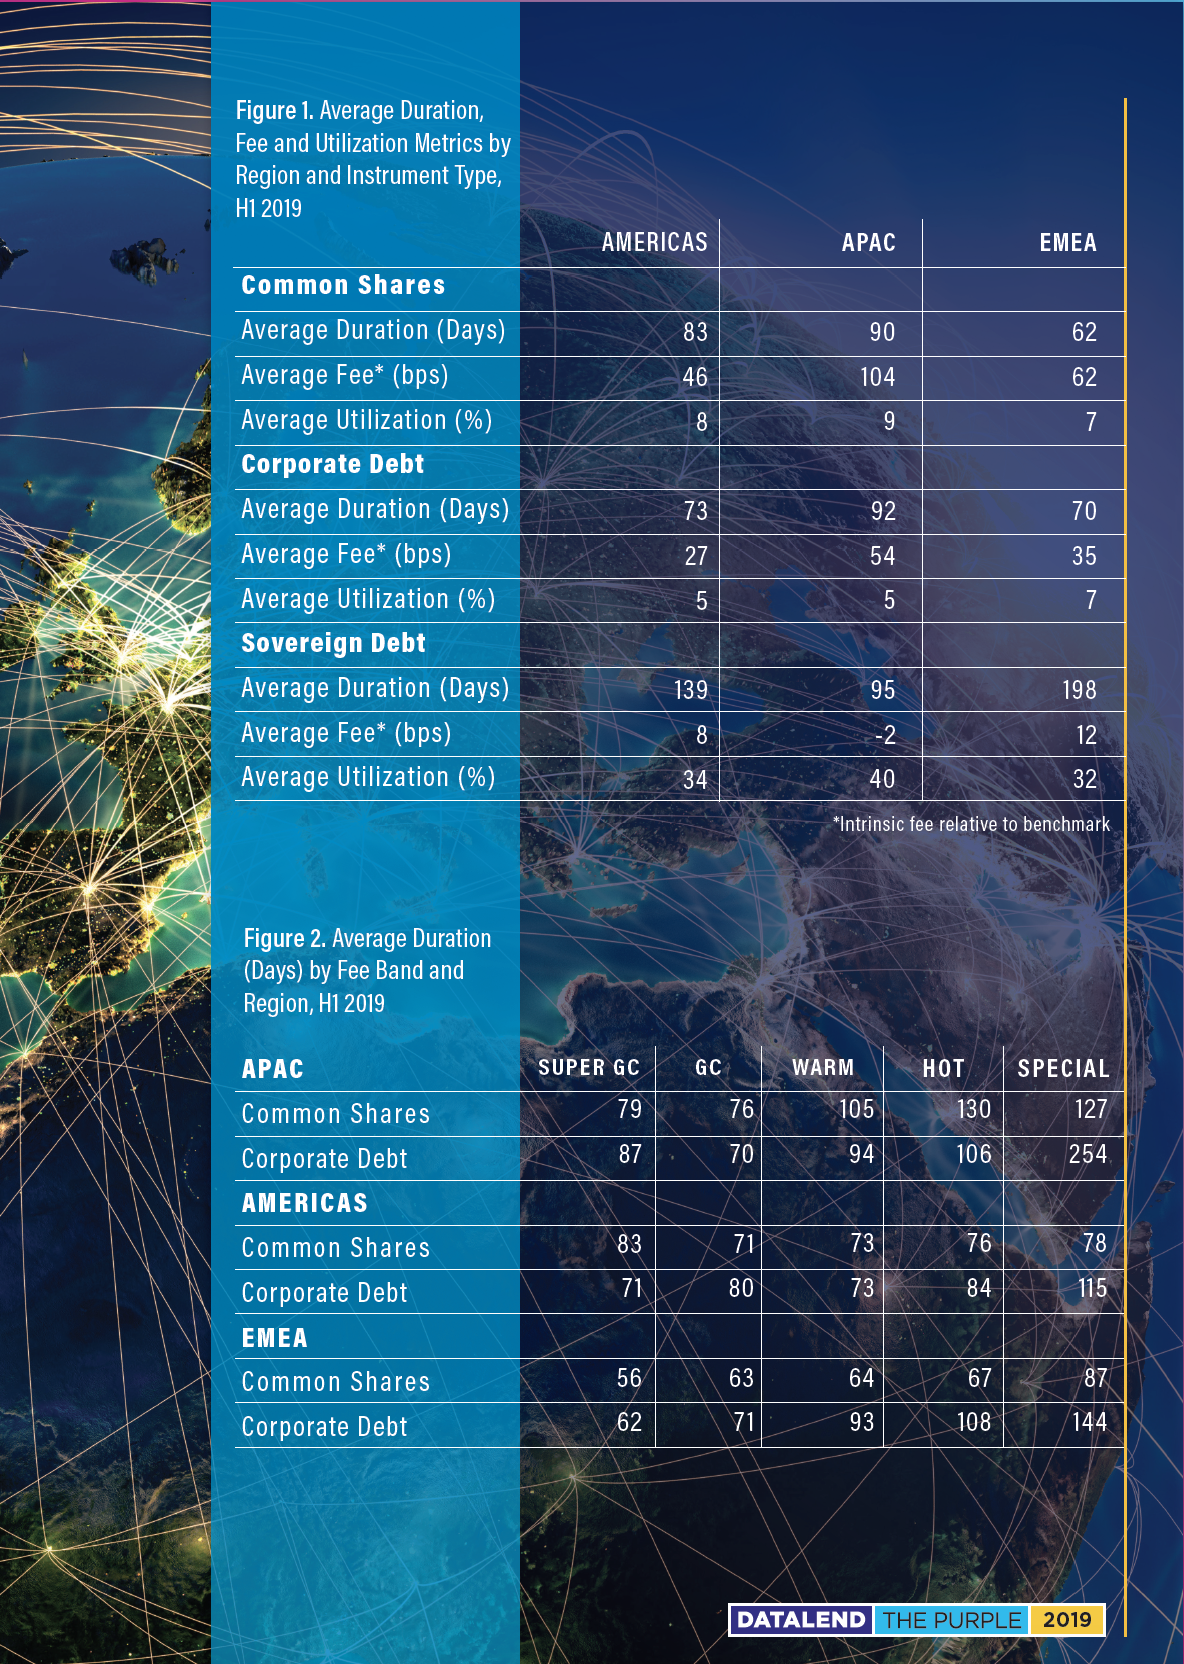
DataLend examined how average duration varies by region and instrument type to see how this metric varies across a range of fee bands: super GC (0-25 bps), GC (26-50 bps), warm (51-100 bps), hot (101-300 bps) and special (300+ bps). DataLend retrieved historic data for all of 2019 YTD to assess any trends occurring within these specific parameters. The results were interesting, and at times unexpected.
Regional Analysis
Loans in the Asia Pacific region generally have a longer average duration (reflected in Figure 1). Looking at both common shares and corporate debt, one can see that the average duration for borrowing common shares in the region is almost seven days longer, or about 8% longer on average, than it is to borrow that same instrument type in the Americas.
The average duration of corporate debt in the Americas is even shorter, at 72 days versus just over 92 days in Asia Pacific. However, this is not the case for all countries in Asia. In Japan and Australia, two of the more established and GC markets in the region, average duration generally appeared shorter and more in line with EMEA or the Americas with average durations of 75 and 66 days, respectively.
This contrasts with other, hotter countries such as South Korea, Thailand and Hong Kong. The fee and supply dynamic in these markets impact the average duration: It may be that once borrowers have sourced the supply of hard-to-borrow securities, they are reluctant to return them even if those securities are re-rated hotter, as sourcing new supply could prove challenging.
EMEA has the shortest average duration of the three regions. This may be due to more new loans being booked (and subsequently returned) due to Europe’s busy spring corporate event season. We can see that the duration for borrowing common shares in EMEA is roughly 28 days, or 46% shorter than APAC. The same shorter average duration to borrow corporate debt in EMEA is also observable and about 31% shorter than the average duration in Asia Pacific.
Instrument Type Analysis
When looking at durations sliced by instrument type, it is clear that sovereign debt has longer durations compared to corporate debt or common shares. A possible explanation for this could be the fact that borrowers borrow sovereign debt over longer time frames to pledge high-quality liquid assets (HQLA) as non-cash collateral against other transactions to meet liquidity requirements as a result of the Liquidity Coverage Ratio (LCR) mandated by Basel III.
Because common and corporate shares trade more actively in the market and are borrowed primarily for momentum short selling, these instrument types would be expected to have shorter average durations, as shown in the data. Market conditions are constantly changing for these two instrument types, leading to more frequent re-rate activity than sovereigns, and subsequently they have higher fees and fee ranges.
Individual Securities
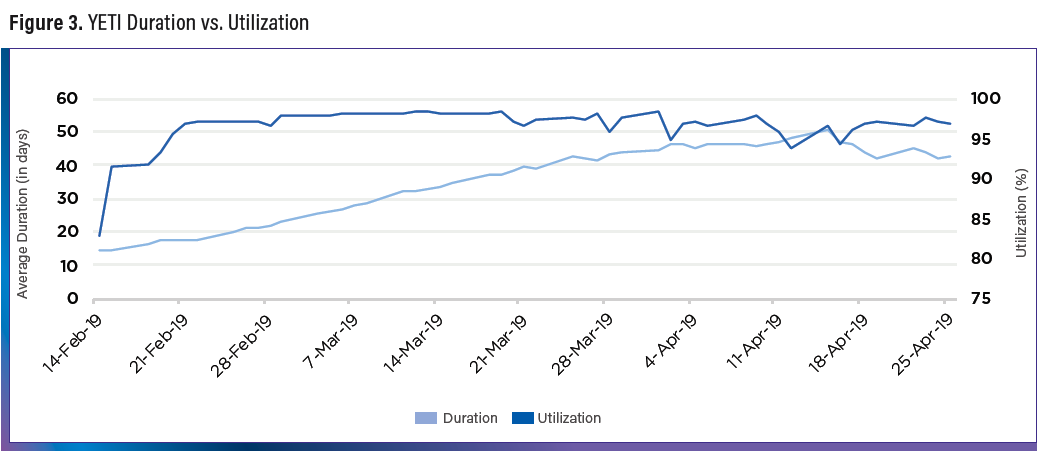
DataLend examined the impact of re-rates on average duration for some individual securities being re-rated hotter over time. Yeti Holdings Inc (YETI) was a security that showed an interesting trend between its fees and average duration. As fees gradually increased in mid-February this year due to the company delivering fourth-quarter results notably higher than market expectations, the average duration increased as well, from a little over 14 days to 44 days. Utilization during this time was very high, peaking at 98% by March. Average fees to borrow YETI increased 2,700% from mid-February to late March, but the re-rating activity happened gradually over time as opposed to sudden, sharp rate increases. The calculated weighted-average re-rate fee for YETI during the time that the fees increased (February 15 to March 29) was 77 bps, meaning that on average shares were re-rated hotter by 77 bps per day. Borrowers were willing to absorb these re-rates knowing that sourcing shares elsewhere would be difficult.

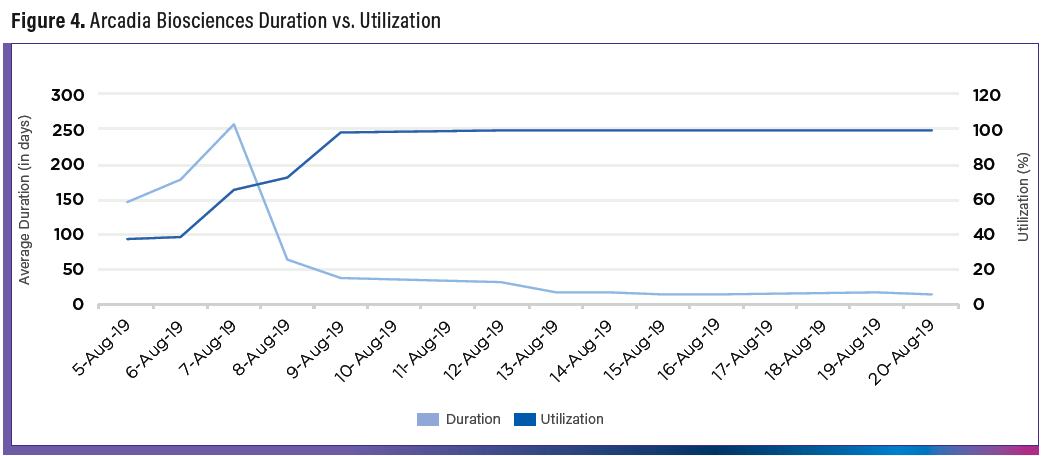
However, in Arcadia Biosciences (RKDA), an agricultural biotech company, we see a different trend occur in August this year. RKDA’s share price had a very sharp move to the upside in August as a result of a USDA approval of their HB4 drought-tolerant soybeans for the U.S. market. Fees to borrow the security were already very high and skyrocketed over 600% between August 9 and August 20. During this timeframe, utilization jumped from 66% to 99%. The significant re-rate increases over a relatively short amount of time seemed to be too much for borrowers to bear given some excess supply in the market; shares were returned, new loans were booked and average duration dropped from 38 days to just 15 during the same timeframe. The weighted-average re-rate fee from August Utilization (%) 2019 Duration Utilization Duration Utilization 5 to August 20 came out to almost 7,500 bps.
These examples illustrate two different patterns, but tie back to previous observations: Securities with very limited supply may have fewer shares returned during re-rate activity and thus longer average durations versus securities trading with lower fees and excess supply (especially given such sharp re-rate activity in RKDA).
Where Can Users Find Average Duration in DataLend?
Like all securities lending metrics, the average duration field can be found across many screens and applications within DataLend.
For example, average duration can be found on a security level on the Data Ribbon in the Security Search screen. It can also be found in the Industry Metrics section of the Research Reports, in the latest version of the DataLend Daily Aggregate Results file and is also a field available in the Excel Add-In and API.
Using average duration in conjunction with other securities lending metrics such as utilization, fees, re-rate activity, new loans and returns can give borrowers and lenders a better understanding of how specific securities trade based on the currently available supply as various circumstances in the securities finance markets arise.


Matt Ross
Product Specialist, DataLend
+1 212 901 2299
matthew.ross@equilend.com

Nagisha Devala
Product Specialist, DataLend
+1 646 767 4359
nagisha.devala@equilend.com

Chris Benedict
Product Specialist, DataLend


