

About-Face in Americas as Q3 2020 Revenue Plunges
Matt Ross, DataLend Product Specialist
October 2020
AT THE HALFWAY MARK of 2020, securities lending revenue was up 7.7% for equities in the Americas. However, by the end of the third quarter, equity revenue in the Americas performed a 180, with returns down 6.2% year to date at the end of Q3. DataLend investigated this reversal and looked at some of the trends that caused the downturn in revenue.
Through the first six months of 2020, the on-loan balances and average fees followed the same trend directionally for both the U.S. and Canada: Loan balances were down in both markets, largely due to market selloffs amid the coronavirus pandemic, while average fees were up in both markets.
In Canada, the uptick in fees was driven by the pharmaceuticals industry and the underlying cannabis stocks, which saw average fees peak in the Health Care sector to over 3,100 bps for several days in late February, the highest level at any point in the last three years. This peak, however, was not enough to overcome the downturn in balances, and therefore Canadian equity revenue was already trending downward by the end of Q2, a trend that would continue into the following quarter.
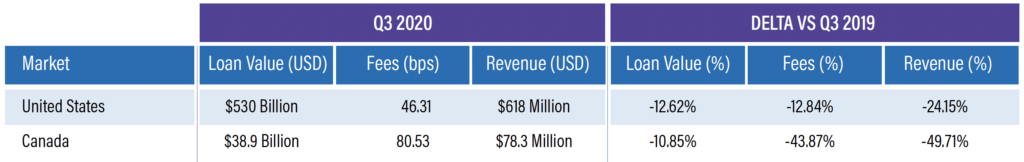
In the U.S., fees were up by more than 25% throughout the first six months, primarily due to COVID-related specials, as noted in “As COVID Unfolds, These Securities Heat Up” on page 4 of this issue of The Purple. However, a handful of other securities also contributed to this increase, including Peloton (PTON), which IPO’d in 2019 and posted large returns in 2020 up until its lockup expiry date at the end of February. Two exchange offers, McKesson Corporation (MCK) for Change Healthcare Inc (CHNG) and Ecolab Inc (ECL) for ChampionX Corp (CHX), were also large revenue drivers in the securities lending market. All in all, the increase in fees drove the U.S. equity market’s almost 11% rise in revenue at the end of Q2. Figure 2 shows how the same two markets fared in Q3 2020 relative to Q3 2019.
The third quarter of 2020 saw downward trends across the board in both the U.S. and Canada. The trend in loan balances from the first six months of the year continued into the third quarter for both the U.S. and Canada. Fees in the U.S. reversed course from the first half of the year and saw an almost 13% reduction year on year, while fees in Canada decreased dramatically by almost 44% year on year. As a result, Q3 revenue decreased 24.15% and almost 50% in the U.S. and Canada, respectively.
As the year progressed, equities markets in the U.S. saw a dramatic climb to return to their pre-pandemic levels, and short positions reached significant lows amidst an S&P record high in August. This overall lack of short conviction is perhaps best illustrated by considering recent IPO activity in the U.S. and the related securities lending activity year on year.
In 2019, Beyond Meat (BYND) generated $120 million in revenue in Q3 alone, which was always going to be hard to repeat in 2020; however, 2019 saw 11 other IPO names generate over a million dollars of revenue each as well. In Q3 2020, on the other hand, only five securities were able to break that million-dollar threshold, one of which was Nikola (NKLA), a global top earner in Q3, which recent news and research suggest may be in Q4 as well.
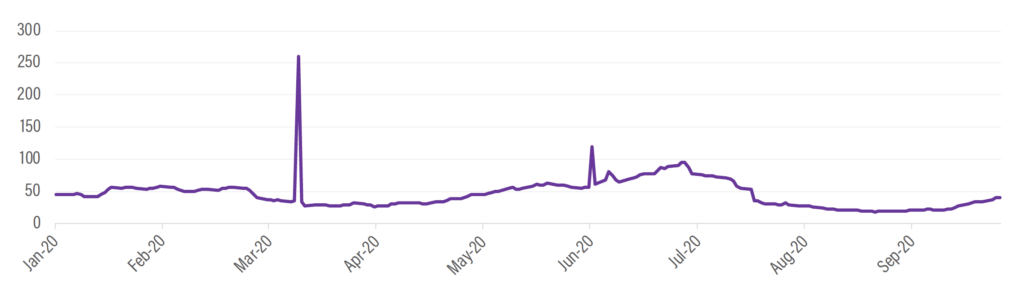
In Canada, cannabis stock prices saw declines year on year, thus reducing the prospects for further short selling and simultaneously lowering the on-loan value of each stock. While securities such as Canopy Growth (WEED CN) and Aurora Cannabis (ACB CN) were still top earners in the region and globally, their overall returns dropped in Q3, which had a noticeable impact on the Canadian market, as illustrated in DataLend’s proprietary DL50 index, which tracks the 50 most hard-to-borrow borrow names in a region and is generally a good indicator of revenue in the securities lending market. This is depicted in Figure 6.
FIGURE 1. H1 2020 EQUITY SUMMARY, U.S. & CANADA
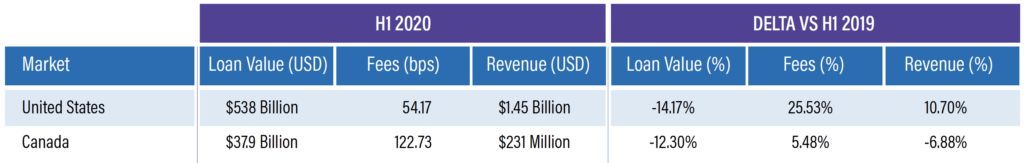
FIGURE 2. Q3 2020 EQUITY SUMMARY, U.S. & CANADA
A few trends may be extrapolated from Figure 6: First, exchange offers are significant revenue drivers, as we see spikes on March 11 for the MCK exchange offer for CHNG and on June 4 for the ECL exchange offer for CHX; a lack of these offers in the third quarter drove revenue down. Additionally, the lack of short selling clearly caused a decline in securities lending activity in the third quarter, causing the DL50 to reach its lowest point in recent memory.
However, more recently, the DL50 has turned upward, potentially indicating increased lending returns in Q4. With an election in the near future and a long list of recent IPOs, Q4 2020 will be an interesting one to watch.
FIGURE 3. 2019 TOP-EARNING IPOS
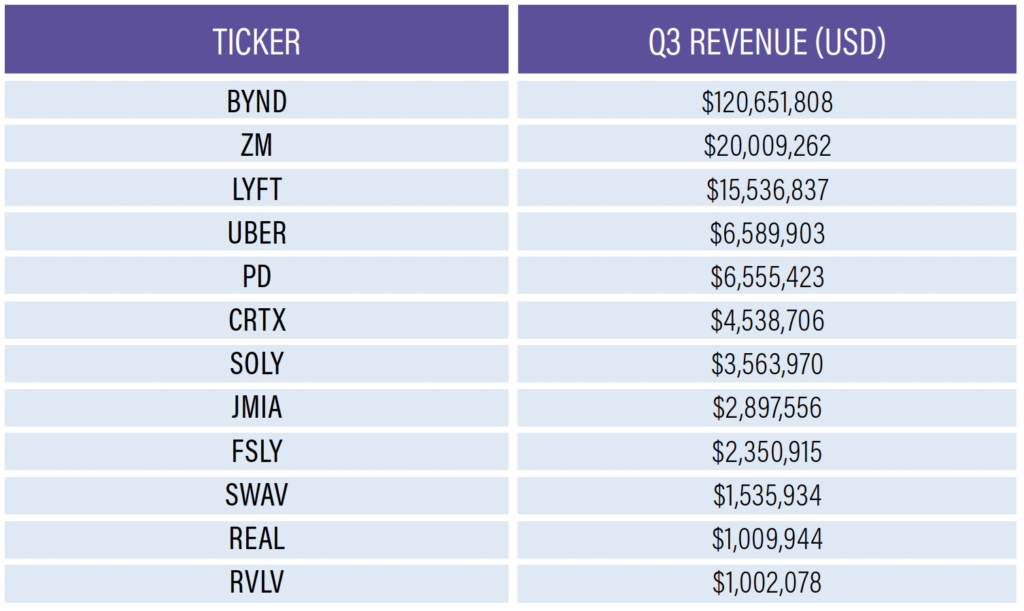
FIGURE 4. 2020 TOP-EARNING IPOS
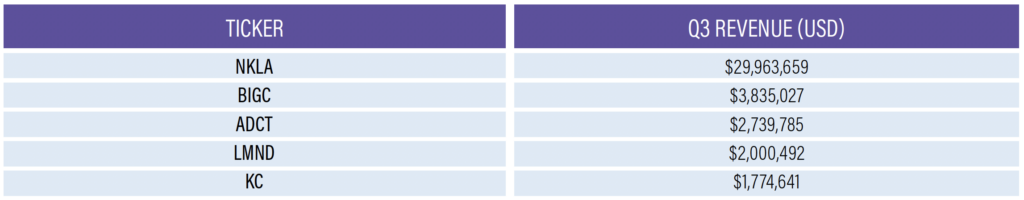
FIGURE 5. EQUITY REVENUE BY SECTOR, CANADA
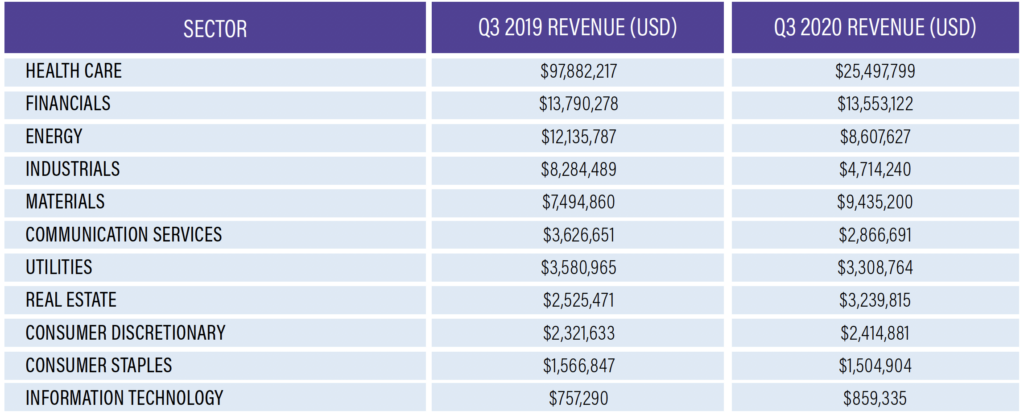
FIGURE 6. DL50 NORTH AMERICA, Q1 - Q3 2020
About DataLend
DataLend is the securities finance market data division of EquiLend. DataLend tracks daily market movements and provides analytics across more than 52,000 unique securities in the $2.2 trillion securities finance market. www.datalend.com

Matt Ross
DataLend Product Specialist
+1 (212)-901-2299
Matthew.Ross@equilend.com