HOW SPECIAL ARE SPECIALS IN SECURITIES LENDING?

MATTHEW ROSS
Product specialist, DataLend
September 26, 2017
Hard-to-borrow securities, also known as specials, make up a considerable percentage of the securities lending market’s revenue, but the 2017 global equity market rally has had a negative impact on the specials market thus also reducing lending revenue. DataLend investigated how the reduction of specials in the market has impacted global revenues over the past 18 months.
DataLend reviewed the fees to borrow for each security in the lending universe across every day over this time period and bucketed them into one of five fee bands. For the purpose of this analysis only lender-to-broker transactions were included while ignoring those that may have been due to seasonal corporate events activity.
Given the $1.8 trillion in assets on loan over the course of H1 2016 (Figure 1), almost 90% of the daily on-loan balance falls within the GC and Barely Warm fee bands. However, when examining the distribution of the roughly $4 billion in lending revenue generated in that period, more than 53%, or about $2.1 billion, was generated by the Very Warm and Hot buckets.
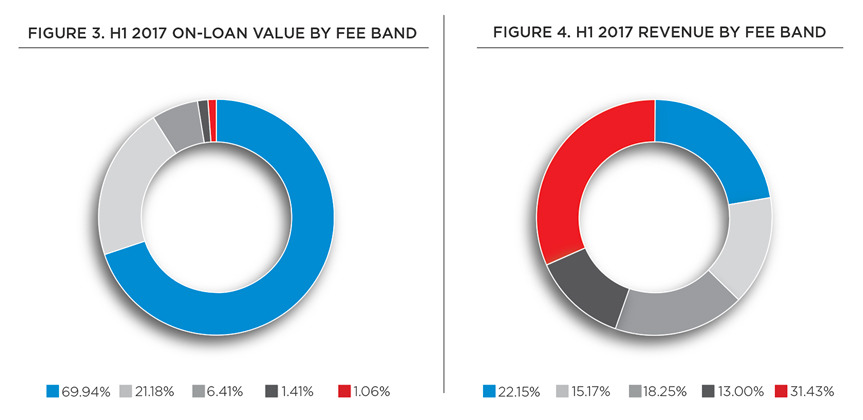
The distribution of on-loan balances by fee buckets in H1 2017 (Figure 3) are fairly similar to 2016, with just over 90% of the total balance falling into the GC and Barely Warm categories. Yet there is a sizable shift in revenues in H1 2017 across the five fee bands (Figure 4). The most noticeable change comes from the Hot category, where securities trading at more than 500 bps earned $1.17 billion in revenue (31% of total revenue) in 2017 versus $1.56 billion (about 40% of total revenue) in 2016—a decrease of almost $400 million, or about 25%.
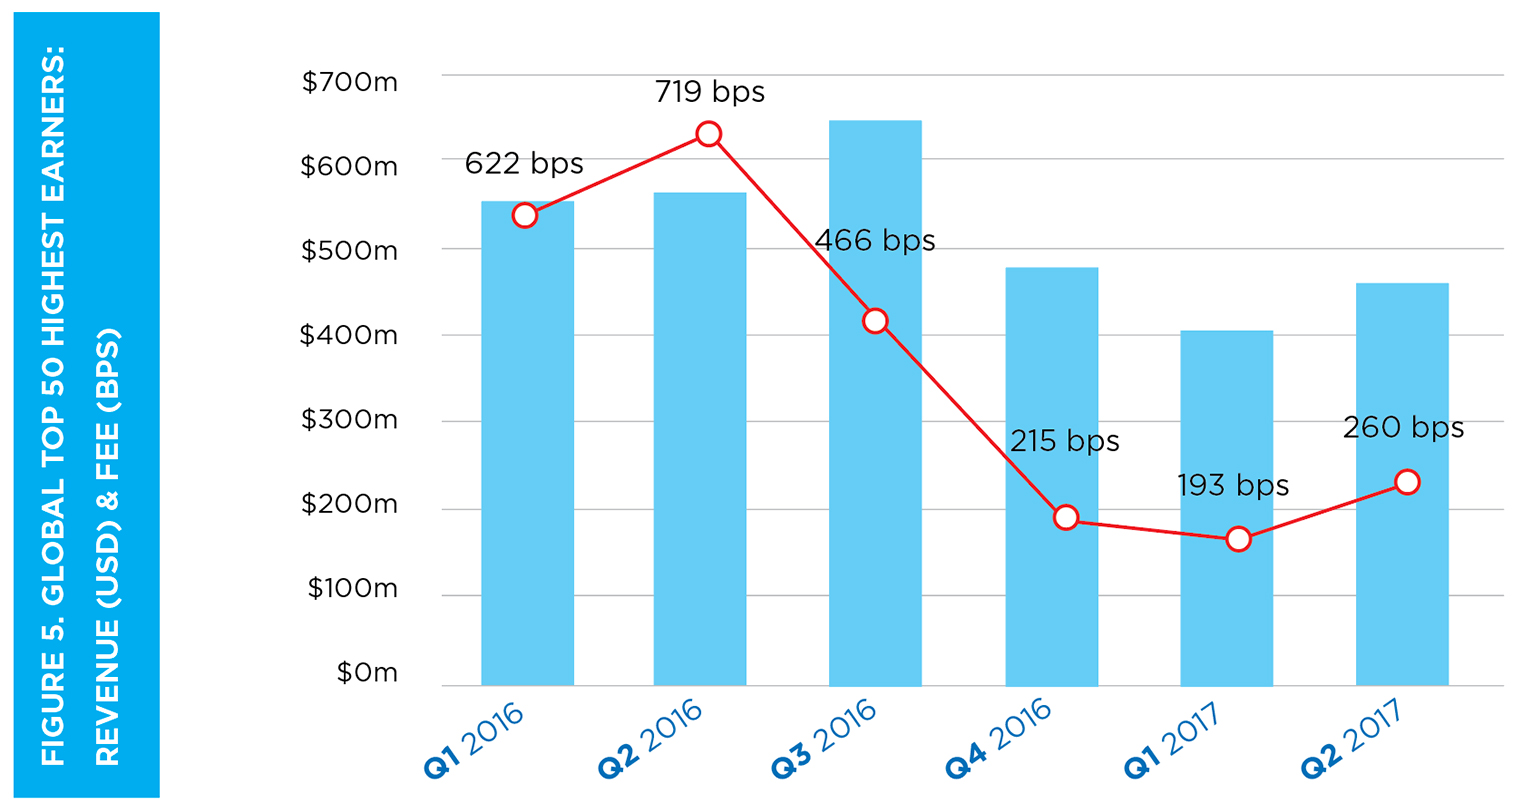
Overall market sentiment remained largely bullish in 2017, while the securities lending industry continued to cool. With less of an appetite for large short positions in a bull market the demand to borrow securities declines, and with less demand to borrow securities comes a reduction in price. To illustrate this, DataLend examined the total revenue generated by and the average fees for the top 50 revenue-earning securities globally dating back to the beginning of 2016 on a quarterly basis. Not only does the resulting chart (Figure 5) show a pronounced drop in revenue, but it clearly illustrates that the cost to borrow the hottest securities in the industry has fallen dramatically as well.
In looking at Figure 5 perhaps the most telling comparison that typifies the reduction in demand to borrow securities is the drop in average fees in Q1 2016 compared to Q1 2017. From January to March 2016, the top 50 names earned almost $560 million in revenue, with staggering average fees of 622 bps; over the same three-month period in 2017, revenue barely topped the $400 million mark, and fees dropped by more than 400 bps to just 193 bps.
The trend is not isolated to one region either, with the drop in specials trend evident across the globe. In the first six months of 2016, multiple names in each region saw fees consistently in the thousands of basis points. While there are some new hot names in 2017, the top earner in each region (the Americas, Europe and Asia) for H1 2016 remained the top earner for H1 2017. Furthermore, each name saw a significant drop in the revenue generated in each six month period, with Tesla’s revenue dropping from $110 million to $55.4 million in the Americas, Fingerprint Cards from $62 million to $18.4 million in Europe and Celltrion from $76 million to $25.5 million in Asia in 2017.
As global markets continue the bullish trend, specials revenue in the securities lending market will likely remain sluggish. However, a revival of specials could be on the horizon, with many hot names popping up within the Consumer Discretionary sector in particular—namely RH and JCP, as noted in “Short Meets Long” on page 8. DataLend will keep close watch on specials trading to see if hard-to-borrow securities make a comeback in the second half of 2017.