
By Chris Benedict, Product Specialist, DataLend
IN A MARKET where global revenue is down significantly, one looks for bright spots where they can find them.
One of the brightest spots in the securities finance market is activity related to initial public offerings (IPOs). The volatility that often occurs during the first days and weeks after an IPO can cause large fee swings, high re-rate activity and an influx of new loans against returns until a proper valuation of the asset can be reached and prices stabilize. Some IPOs can initially trade warm to hot, only to settle toward a more GC level just a few days later. Other IPOs can remain red-hot for weeks or even months at a time as optimistic long investors battle the more sanguine short sellers who may disagree with a company’s post-IPO valuations. As a result, IPOs can be a significant source of revenue for lenders in the securities finance market.
The primary objective of an IPO is to raise new capital to help fund a company’s growth. There are a number of factors that determine the price of an IPO, including investor demand, the company’s growth prospects, the price-to-earnings ratios of competitor firms in the same industry, the reception of a company’s “roadshow,” the size of the issue, the economic health of the overall market and other considerations. The higher the investor demand for the company, the higher the company can price its shares and the greater the potential profit from the offering.
Too much demand in the form of a very high IPO price may appear to be “irrational exuberance” by some market participants; investors may believe the secondary market IPO price is too expensive and will seek to borrow shares immediately in the aftermarket once the IPO has settled to execute a short sale of a potentially overvalued asset.
While DataLend’s analysis is written from a securities finance perspective, there are other components that can impact how an IPO trades and the stock’s subsequent fee to borrow. These components include the size of the IPO, the number of pre-IPO financing rounds and the sophistication of that investor base, the capital structure of the company and volumes in the cash markets, amongst others.
The number of issues brought to the IPO market in 2019 has been a bit subdued compared to recent years, possibly due to heightened geopolitical tensions and ongoing uncertainty around trade issues amongst the U.S., China and the EU. Still, there were plenty of high-profile, large, very hot and gravity-defying IPOs in both the traditional cash and securities finance markets.
DataLend looked back at the top 50 most actively traded IPOs thus far in 2019 across various countries, sectors and industries to see if there were common trading patterns across the issues.
Fees to Borrow
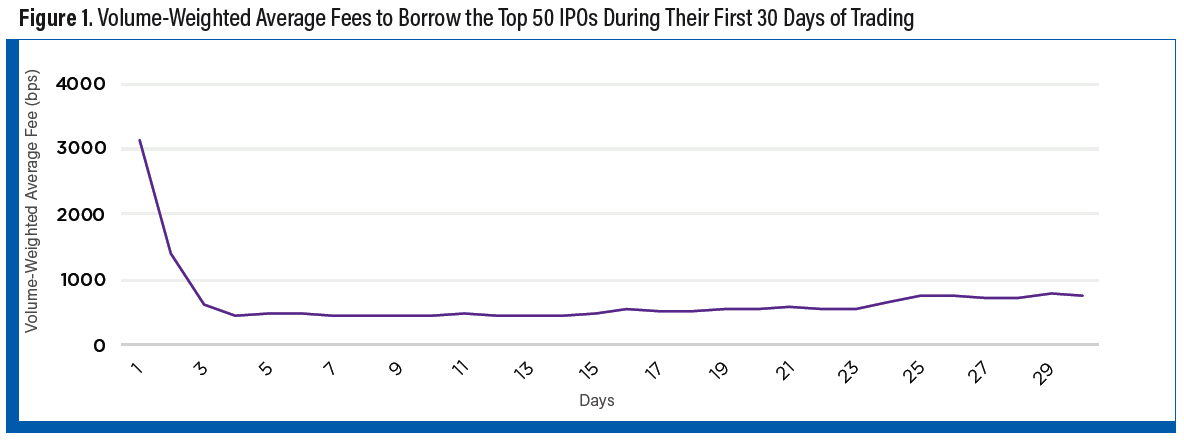
One common theme observable across many of the top 50 IPOs of 2019 was that volume-weighted average fees (VWAF) to borrow the newly issued securities skewed extremely high during the first few days of trading in the securities finance market. On average, they then tended to cool off over subsequent weeks.
DataLend calculated and plotted the combined VWAF for a basket of the top 50 most actively traded IPOs issued in 2019 from all sectors and countries around the world during their respective first 30 days of trading in the securities finance market. The VWAF to borrow this basket of IPOs was priced at just below 3,000 bps on the first day of trading, as seen in Figure 1. The average fee plummeted to around 1,300 bps by the second day of trading. By the fourth day of trading, the fees to borrow the basket of IPOs had settled into a 400 bps to 500 bps trading range. Calculating the standard deviation of VWAFs for the IPO basket across the 30-day timeframe yielded a figure of 498 bps, indicating a wide range of fees and high volatility for the IPOs during their initial days in the securities finance market.
Undoubtedly, some very high-profile and volatile IPOs magnified this effect. Highly traded names such as Beyond Meat (BNYD), Lyft (LYFT), Slack Technologies (WORK), Zoom Media (ZM), Change Healthcare (CHNG), Adaptive Biotechnologies (ADPT), Jumia Technologies (JMIA) and others started their initial days trading in the securities finance market commanding several thousands of basis points in borrow fees before cooling.
Even when removing these very hot names from the data set, other newly issued securities such as Ascelia Pharma (ACE SF), Nexi Spa (NEXI IM), Tufin Software Technologies (TUFN), JDC Corporation (1887 JP), Uber Technologies (UBER), Pinterest (PINS), Chewy Inc. (CHWY), Crowdstrike Holdings (CRWD) and others followed a similar pattern of high fees to borrow in the early days of trading followed by a significant drop in those fees by the fourth or fifth day.
However, fees to borrow the top 50 IPOs reversed that downward trend beyond the second week of trading, rising from 473 bps on day 15 to over 766 bps by day 30. Some of the securities contributing to this trend reversal include Bicycle Therapeutics (BCYC), Stoke Therapeutics Inc (STOK), Akero Therapeutics Inc (AKRO), HOOKIPA Pharma Inc (HOOK), Luckin Coffee (LK), Lyft and Beyond Meat. Beyond Meat was so successful in the cash markets that the traditional rules of banking were modified to accommodate restricted shareholders in an unprecedented move: Private equity holders were able to reduce the traditional lock-up period and sell additional shares on July 31 at $160 per share, an incredible 540% increase from the IPO price of $25 per share just three months earlier.
Beyond Meat will be cited as one of the most successful IPOs of this year, as well as one of the top-earning securities in securities finance for 2019.
In the above examples, the security prices in the cash markets stabilized and rebounded. This in turn enticed bearish shorts to increase their existing positions, or to enter back into the market after covering. This illustrates that there is still volatility (and profitability) for IPOs in the securities finance market well beyond the first weeks of trading.
Lendable Supply
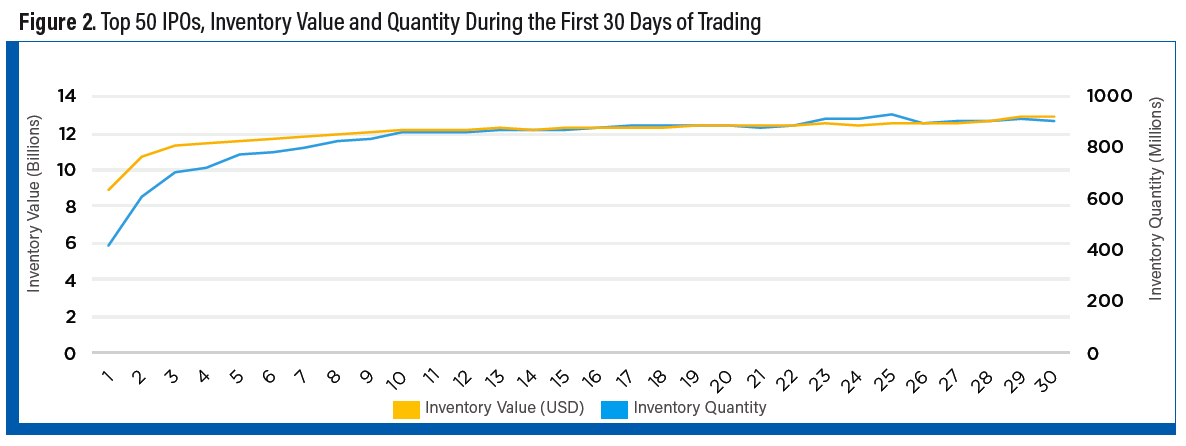
As noted, the first few days after an IPO begins trading can be chaotic in both the cash and securities finance markets. As the security price in the cash market fluctuates, new loans are booked, rates are renegotiated (or shares are returned) and beneficial owners make their long supply available to the market. However, that lendable supply for some IPOs may appear to be somewhat uncertain during the initial days of trading. When charting the total inventory value and quantity across the basket of top 50 IPOs of 2019 over the first days of trading in the securities finance market, we can see a bit of a ramp up in lendable supply in Figure 2. Even when adjusting for potential price appreciation in the cash markets by plotting lendable quantity instead of value on the second axis, the initial increase in lendable supply is apparent. This behavior is likely attributable to institutional investors right-sizing their portfolio investment based on valuation and target ownership.
This ramp up in supply could be inversely correlated to the high fees to borrow IPOs during their initial days trading in the securities finance market: As beneficial owners allow their agent lenders to lend their newly purchased IPOs, supply is made available to prime brokers to borrow on behalf of hedge funds executing short sales. As the supply increases, newly borrowed shares can command lower fees.
However, hedge funds waiting for fees to decrease before they decide to borrow might lose out on the opportunity to short while post-IPO prices are high. For example, traders waiting for fees to cool before borrowing Lyft, Atreca Inc. (BCEL), Greenlane Holdings (GNLN) or Jumia Technologies (JMIA) may have missed out on fairly significant price drops immediately after the IPOs came to market.
There could be a few reasons for this “lendable lag.” Some reasons could be operational related, such as ensuring accurate IPO settlement and allocation across various beneficial owner accounts. Other causes might be business related, such as beneficial owners’ hesitation to act until prices in the cash and securities finance markets stabilize, or anticipation of fees or rebate rates reaching a certain profitability threshold before making their supply available. Others still might be only making part of their inventory available to lend initially, doling out some of their position over time. Supply may also be impacted by regulatory requirements on the ability to margin newly offered securities. Whatever the case, as new loans are being booked and inventory comes into the market, utilization figures can see some significant day-over-day swings of an IPO’s early trading days in the securities finance market.
Re-Rate Activity
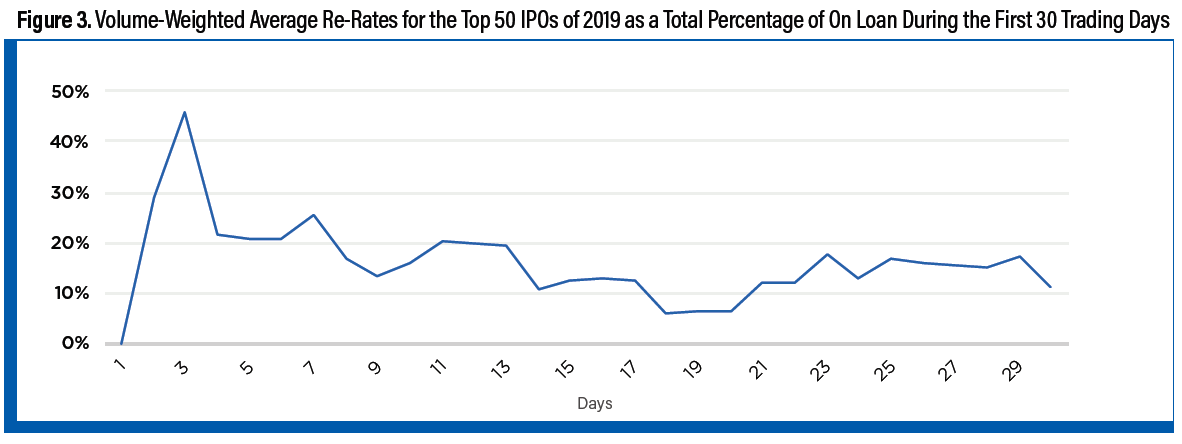
Hand-in-hand with initial fees skewing higher just after an IPO reaches the aftermarket, so too do we see a flurry of re-rate activity across many IPOs in the early days of trading in the securities finance market. DataLend calculated the re-rate activity as a percentage of total on-loan balance across the basket of top 50 IPOs during the first 15 days of trading in the securities finance market to investigate this activity.
Per Figure 3, the re-rating activity peaked on the third business day, where a little over 45% of the entire on-loan volume of our list of 50 IPOs was re-rated during this time. That re-rate percentage drops significantly down to around 23% of the total on-loan volume across our basket of IPOs as market prices, fees to borrow and lending supply begin to stabilize by the third trading day. After 17 business days, the percentage of total onloan volume being re-rated decreases to below 10%, but much like the VWAF in Figure 1, re-rate activity picks back up during the latter half of the 30-day period.
The volume of re-rate activity depends on how much interest and volatility there is in the settled IPO to begin with. For example, some 68% of the total on-loan volume of Uber was re-rated cooler on May 16, the third day of that security trading in the secondary market. Lyft saw almost 53% of its total onloan volume re-rated cooler on the third day of trading in the secondary market on April 4, while Pinterest saw almost 55% of its total on-loan volume re-rated on April 25, three days after the IPO. Other IPOs with significant re-rating activity during the initial days of trading in the securities lending market included GSX, Beyond Meat and Zoom Media.
One commonality observed in IPOs with a high degree of re-rating activity was a very high initial fee to borrow just after the IPO settled. Lyft saw fees to borrow drop a staggering 88% in the three days after the IPO began trading. Zoom Media saw a 54% decrease in fees to borrow during the same timeframe. Other IPOs with very high fees to borrow show similar re-rating patterns. This in turn is possibly related to changing lendable supply: As more supply comes into the market, new loans are booked with lower fees than previous days, and borrowers begin to look for rate relief on their previously borrowed shares.
However, there were a number of IPOs in the top 50 that saw little to no re-rate volume during their initial weeks of trading, including Traton SE (8TRA GF), Stadler Rail (SRAIL SE), Personalis Inc. (PSNL), Network International Holdings (NETW LN), Crowdsource (CRWD), The Realreal Inc. (REAL) and others. Not surprisingly, newly settled IPOs with little to no re-rating activity are typically characterized by low utilization and fairly low fees to borrow.
Only a handful of the top 50 IPOs were re-rated hotter during the first few days of trading. These included Douyu International Holdings (DOYU), Xinyi Energy Holdings (3868 HK) and Stoke Therapeutics. Luckin Coffee Inc and Beyond Meat were mixed as both names were re-rated cooler during their initial days of trading, only to have the re-rate direction reversed to head hotter after the fourth or fifth day of trading.
Profitability
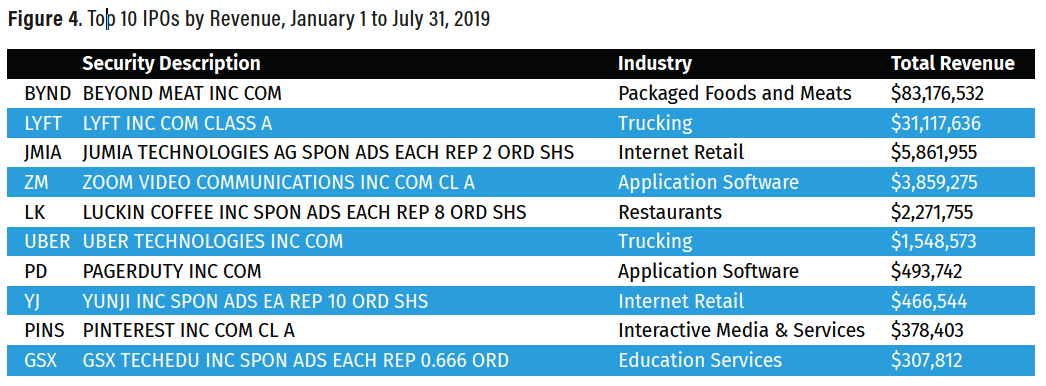
The frenzy of activity in the days following an IPO can yield substantial positive results in the form of higher-than-average lending revenue. The basket of tracked IPOs referenced throughout this article generated a little over $130 million in lender-to-broker revenue globally for securities lenders from January through the end of July 2019. The most profitable IPO this year (by far) is Beyond Meat, which generated over $83 million on extremely high average fees from early May to the end of July.
Beyond Meat’s fairly sizeable daily average on-loan value of $380 million—as a result of its positive performance in the cash markets—also helped to drive revenue. Lyft came in a distant second in terms of profitable IPOs with revenue of over $31 million from April to July 31 of this year with fees averaging just over 1,000 bps. Lyft also provides an interesting contrast to its competitor, Uber, which floated in May but has only generated $1.5 million in revenue on much lower fees by early autumn 2019. At the time of writing, Lyft had a market cap of $13.8 billion, while Uber commanded a much larger $59 billion market cap.
The outlook for other high-profile IPOs later this year seems uncertain. We Co. (better known as WeWork) was expected to be the next big IPO with an estimated $47 billion valuation. That changed when anchor investors cut their internal reserve calculation to just $20 billion in early September. This valuation slash combined with concerns around its corporate governance prompted We Co. to postpone its IPO. Saudi Arabia’s much-anticipated mega-IPO of Aramco also looks to be delayed after an attack on its oil facilities. It will be interesting to see how these names trade in the securities finance market when they finally go public.
As noted, IPOs can be a significant source of revenue in the securities finance market. The Security Performance Reporting screen in DataLend’s Client Performance Reporting and DataLend Portfolio platforms is an excellent resource to measure profitability performance in IPOs against different customizable peer groups.
In addition to the various metrics listed in this article, intra-day data such as the top 100 indications of interest (IOIs) from NGT on the Market Movers screen may help to gauge interest in IPOs on the morning they begin trading. Intra-day recall information within the Transactions widget on the Security Search screen could also be beneficial in spotting changing market demand.
The New Loans Versus Returns histogram in the Graph Builder of DataLend’s Security Search screen aids in determining demand patterns for securities, whether they are heating up or cooling down. Users are also able to track dayover- day, week-over-week and monthover- month changes in fees, utilization, on-loan values and many other metrics in the Research Reports Deltas screens across a custom list of uploaded securities as well as specific asset classes, countries, sectors or the market as a whole. By incorporating these and other metrics from DataLend’s user interface, Excel Add-In tool or API across any basket of securities, users can determine the volatility—and potential profitability— of any issue trading in the securities finance market.