From Big Data Emerges Precision Analytics

Matt Ross,
Product Specialist,
DataLend
September 19, 2018
GLOBAL TRADING ACTIVITY on NGT, the leading trading platform in the securities finance marketplace, continues to rise as firms seek to automate as much of their activity as possible.
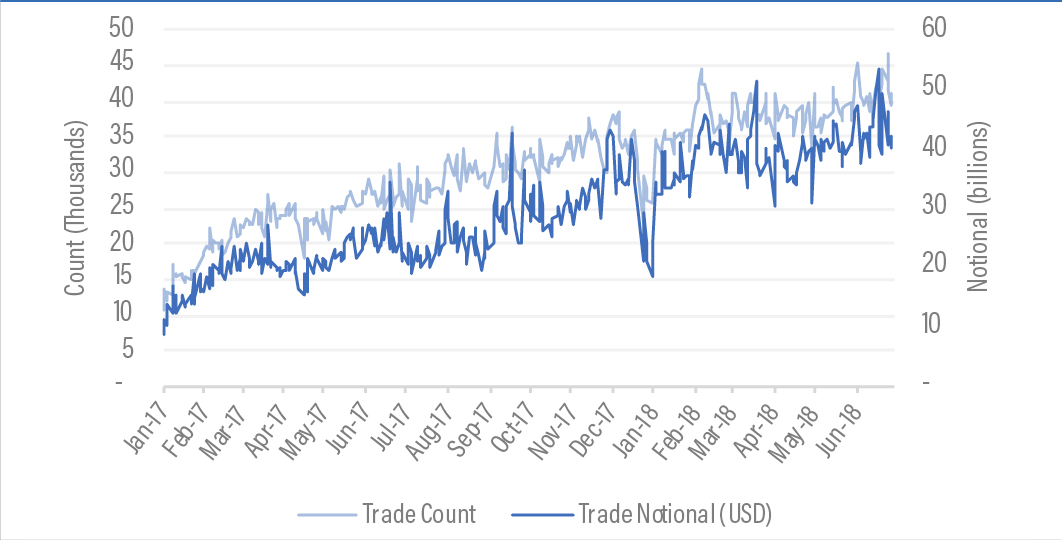
The platform now processes an average of $43 billion in trade notional from over 6.2 million trade requests across more than 60,000 unique securities each and every day (see Figure 1). What that means is NGT is home to a lot of data!
Financial institutions are focused on the consumption and interpretation of big datasets to make more informed trading decisions (see “Big Data in Securities Finance”). Gaining insight into NGT data affords EquiLend clients the opportunity to develop more efficient trading strategies.
To provide our clients with the most robust analytics available, EquiLend brought together DataLend’s powerful data processing and visualization know-how with NGT’s dataset to bring you The Pulse—Precision Analytics Powered by DataLend.
As technology and data continue to play a vital role in the financial world, MIS tools, like The Pulse, utilize big data technologies to help market participants interpret all of this information. The ability to recognize patterns and therefore drive decision making are two key aspects of good MIS reporting; many firms today are investing in new tools to view large datasets in an easy-to-digest manner. The Pulse was designed with these key concepts in mind.
The Pulse was built to help borrowers and lenders answer two questions: Who are my most active and efficient counterparts on NGT, and how does my firm, or desk, compare to the rest of the industry and my peers on NGT?
While The Pulse no doubt has succeeded in helping the securities finance industry answer those two questions, the functionality and use cases for The Pulse have grown exponentially and will continue to evolve as the market becomes more automated.
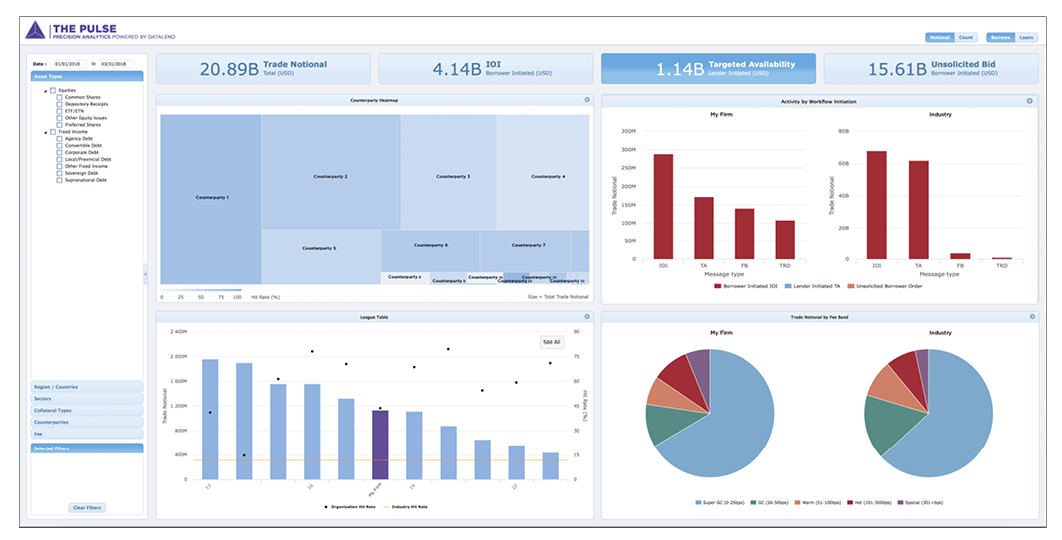
By leveraging DataLend’s security classifications, The Pulse allows NGT participants to view their and the industry’s activity on NGT across any combination of market, asset type, sector, collateral and fee band. That flexibility, combined with a quick, responsive and user-friendly Web-based user interface, allows subscribers of The Pulse to start asking and, more importantly, answering the right questions about their trading patterns. The Counterparty Heat Map provides organizations insight into their largest and their most efficient trading partners on NGT. Trading desks and managers can use this tool to better understand trade flows across the IOI, Targeted Availability and Unsolicited Bids work streams at the counterparty level.
Why does this matter? Trading desks can leverage this data to identify which counterparts are sending high volumes of requests but generate low trade counts, and which counterparts may not be responding to trade requests at all. Viewing activity across all counterparts in one consolidated view allows desks to optimize trade flow and maximize opportunities.
The Pulse also allows traders to view counterparty details in the Counterparty Trending graph. With this slice of data, a trader can identify if changes to internal algorithms and thresholds will have a material impact on balances and efficiencies for each counterparty. Simple tweaks to borrowing and lending thresholds could result in a significant increase in hit-rate and revenue.
The Pulse League Tables allow both borrowers and lenders to rank themselves relative to their peers. Firms are constantly asking: Am I the fifth biggest participant in a market, or am I the first? Finding your position in a given asset class, market, sector or fee bucket is critical information for understanding where there is opportunity for gaining market share.
The Market Share by Fee Bucket graph has garnered a huge amount of interest from our clients. Intrinsiconly lenders can obtain insight to how they rank in that fee band, and for predominantly GC firms, The Pulse provides insight into the hard to borrow space and where there is potential market share to be gained.
The Pulse also arms NGT users with the information necessary to make a business case for capturing additional flow on NGT. Debating whether or not to enter into the IOI workflow on NGT? Use The Pulse to see not only the depth but also the breadth of activity being captured via the IOI workflow. Want to start borrowing or lending against non-cash collateral? Use The Pulse to see how many competitors are already participating in that space.
While The Pulse is already serving up large amounts of data, it is a living product that will continue to grow. Additional functionality will be added to The Pulse in 2018, including legal entity filtering and GC versus rate taker versus explicit bid filtering capabilities. Most importantly, transaction-level detail will be introduced across all NGT workflows.
With no end in sight to the expanding role that data will play in the financial markets, The Pulse will ultimately look to bring together all elements of the securities lending workflow from pre-trade decisionmaking to post-trade analytics. The DataLend team is excited to be bringing this new level of transparency to the market.

Figure 1. NGT Trade Count and Notional


